CPU activity at a glance
Choose a percentage, bar or graph. Open the CPU details for user and system activity, or the Apps tab to see which apps are busy.
Understand CPU usage → GlimmerStatsBar
When your Mac feels busy, a quick look can help. Keep CPU and memory nearby, then add the readings you want to see. GlimmerStatsBar (mac stats bar) gives you one clear place to choose.
Free. macOS 13 or later. No app account or subscription.
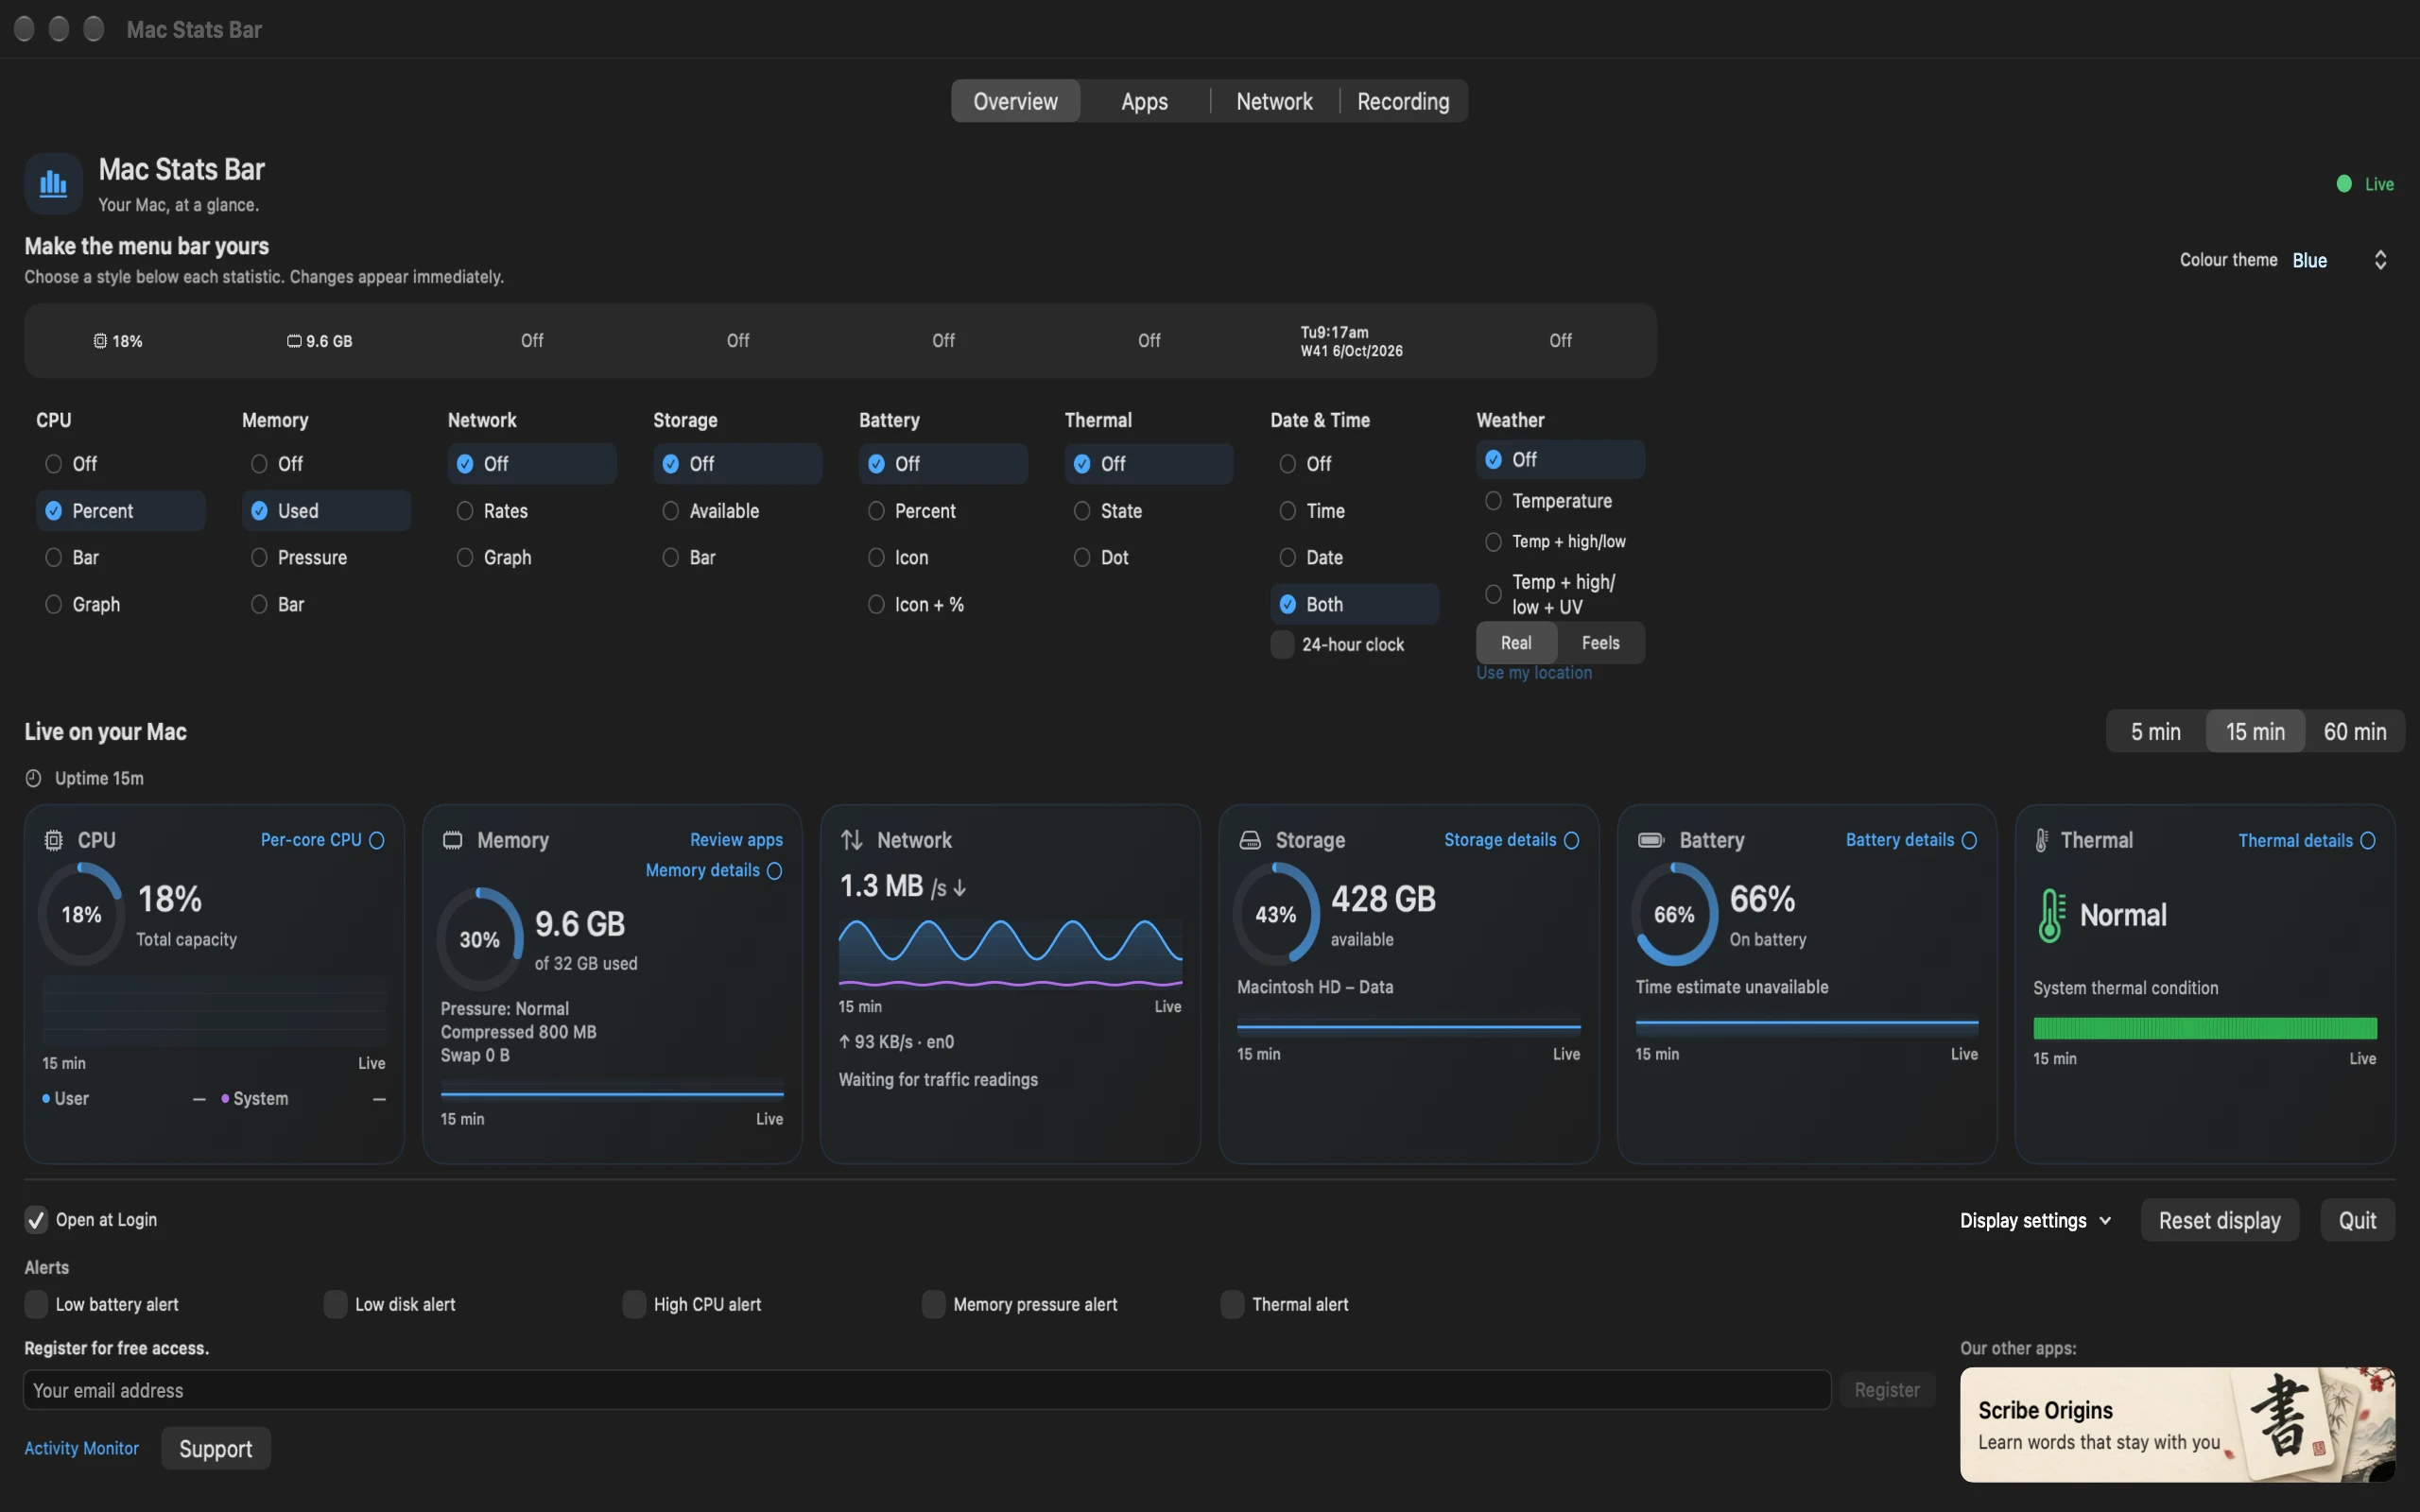
CPU and used memory start in your menu bar. Add another reading when it is useful, or choose Off to keep the bar compact. The live cards remain available in the app.
Choose a percentage, bar or graph. Open the CPU details for user and system activity, or the Apps tab to see which apps are busy.
Understand CPU usage →See used memory, compression, swap and memory composition. The Apps tab helps you follow an individual app without treating every used byte as a problem.
Read memory more clearly →Watch upload and download rates, explore connections on a world map and sort traffic by app or destination. Per-app traffic is optional and needs macOS approval.
See what network rates mean →Keep free space nearby, follow physical disk read and write activity, and check battery health, cycles and power details when your Mac reports them.
See your Mac’s thermal condition alongside GPU details. An optional sensor companion adds supported temperature and fan-speed readings with history.
Understand the thermal reading →Add the time, date or both. The date display includes an ISO week number, and the clock follows your Mac's local time zone.
Record CPU, memory, network, storage and battery readings locally. Keep up to 24 hours of sampled history and export a CSV when you want to compare a longer session.
Choose optional alerts for low battery, low storage, sustained CPU use, memory pressure and thermal pressure. Leave them off when a quiet menu bar is all you need.
Start with Overview, then open Apps, Network or Recording when you want a closer look. Live charts offer 5, 15 and 60-minute views. Record a longer session and export it as CSV.
Record a session locally to keep up to 24 hours of sampled history, then export a CSV when you want to look back.
Choose your menu bar styles and colours, and turn on only the alerts you want: low battery, low storage, sustained CPU usage, memory pressure or thermal pressure.
Read the privacy policy →Open Apps to sort CPU and memory use and follow the selected app’s history. Optional companion details add memory footprint, disk activity and thread counts.
GlimmerStatsBar (mac stats bar) brings menu bar readings, app monitoring, network maps and local recording together for free. Compare it with iStat Menus, iStatistica Pro and Stats around the tools you use.
Compare free monitoring, sensor support, alerts and fan controls.
Read the comparison →Menu bar or wider dashboardCompare app monitoring, network maps, recording and remote tools.
Read the comparison →Two free approachesChoose around the readings and controls you want to use.
Read the comparison →GlimmerStatsBar is free and available now. Leave your email to request the download link.
macOS 13 or later. No app account or subscription.
Yes. GlimmerStatsBar is a free Mac system monitor with no app account or subscription required. It is available now. You can request the free download link on the homepage.
CPU, memory, network rates, available storage, built-in battery charge, thermal condition, and date or time. Each has its own display choices, including Off. CPU and used memory start visible; the other items start Off.
Yes. GlimmerStatsBar is free and includes menu bar readings, GPU details, app monitoring, network maps, local recording and alerts. An optional companion adds supported temperatures and fan speeds. Compare the features you use in our guides.
An optional sensor companion adds temperatures in degrees and fan-speed history on supported hardware. The thermal condition reported by macOS remains available separately.
Off hides that item from the menu bar. Its live reading remains in the app below the display controls. You can keep the menu bar small and open the app when you want more detail.
Some readings need a fresh baseline, so the first CPU or network interval can be blank. Sleep and route changes can also leave gaps. Memory pressure stays unavailable until macOS reports a pressure event. A desktop can show Not present for the battery.
GlimmerStatsBar requires macOS 13 or later.